Reading OHLC: candles, gaps and timeframes
Combine four hypothetical hourly candles and see which information a chart retains and which it loses.
A candle summarizes prices over an interval. OHLC means open O, high H, low L and close C. These are four observations, not a record of every trade or a ready-made forecast.
Read the body and wicks
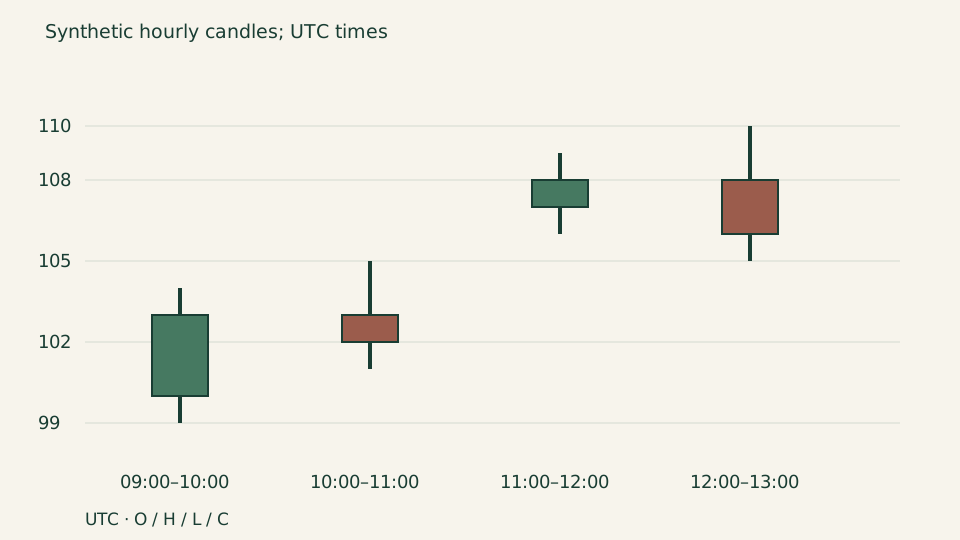
The body connects O and C; the wicks extend to H and L. Color usually distinguishes a close above the open from one below it, but chart settings vary. Check numbers and the legend rather than relying only on green or red.
For an unfinished candle, H, L and C may still change. A completed candle does not reveal whether the high or low came first. Different intraperiod price paths can share exactly the same OHLC.
Four hypothetical hours and a gap
All intervals in the table are UTC and the prices are invented. At 11:00 the new candle opens at 107 after the previous close of 102. The opening gap relative to that close is +5 units.
This does not prove that all intermediate prices traded. The cause is unknown from this table. In actual data, check the trading session, missing records, provider and instrument conventions.
Our own teaching example; all figures are hypothetical.
| UTC interval | O | H | L | C |
|---|---|---|---|---|
| 09:00–10:00 | 100 | 104 | 99 | 103 |
| 10:00–11:00 | 103 | 105 | 101 | 102 |
| 11:00–12:00 | 107 | 109 | 106 | 108 |
| 12:00–13:00 | 108 | 110 | 105 | 106 |
Build a larger interval
For 09:00–11:00, take the first O=100, highest H=105, lowest L=99 and last C=102. For 11:00–13:00 the result is 107, 110, 105, 106. For all four hours, 09:00–13:00, it is 100, 110, 99, 106.
The larger candle hides the hourly gap and intermediate closes. Session boundaries and timezones can change the grouping. Before an Elliott calculation, check the input series, timeframe and whether the last bar is complete.
Can the four-hour candle prove that 99 occurred before 110?
No. OHLC shows extremes and interval boundaries, not the order in which the high and low occurred.
One bar: an interim snapshot and the final close
For a separate 10:00–11:00 UTC interval, at 10:30 we know O109,H111,L108.9 and last price 110.8. That is not final C. After 11:00, OHLC is 109/111.2/108.4/109.5. The open stayed fixed while extremes and the last price changed.
Under a preselected completed C>110 rule, interim 110.8 is insufficient and final 109.5 fails. Do not award an earlier entry using later knowledge of the close. Keep availability times and snapshots separate; bar completion does not automatically establish wave completion or a fill.
| Record | O | H | L | C | Status / condition |
|---|---|---|---|---|---|
| During interval | 109 | 111 | 108.9 | 110.8 | 10:30 UTC |
| After completion | 109 | 111.2 | 108.4 | 109.5 | 11:00 UTC; 109.5≤110 |
Does last price 110.8 at 10:30 pass the rule?
No. It requires a completed bar; the 109.5 known after 11:00 is not above 110.
Heikin Ashi: a calculated price is not a market fill
Use separate rawA100/104/98/102 and rawB112/118/110/116. HA-close=(O+H+L+C)/4; HA-open[t]=(HA-open[t−1]+HA-close[t−1])/2; high=max(rawH,HA-open,HA-close), low=min(rawL,HA-open,HA-close). Seed A’s HA-open with(rawO+rawC)/2=101. Thus HA_A=101/104/98/101 and HA_B=101/118/101/114.
B’s synthetic open 101 is below its entire raw range[110,118], and HA-close 114 is not raw-close 116. These fields establish no available fill. History start and seed affect the recurrence; preserve raw OHLC and transformation settings. For wave extremes and execution assumptions return to the relevant source data; even a raw-level touch is not by itself a guaranteed trade.
| Record | O | H | L | C | Status / condition |
|---|---|---|---|---|---|
| A | 100 | 104 | 98 | 102 | Source OHLC |
| B | 112 | 118 | 110 | 116 | Source OHLC |
| HA_A | 101 | 104 | 98 | 101 | Computed HA |
| HA_B | 101 | 118 | 101 | 114 | 101<110 |
Is HA-open B=101 the actual opening price of B?
No. Raw B opens 112 and ranges 110–118.101 is transformed, not an observed opening or execution.
Renko: brick index versus source time
Use only an upward traditional-Renko fragment with box 1 and a supplied last up brick 99→100. Completed source closes 100,100.4,101.2,103.1 yield no new brick at 100.4,100→101 at 101.2, then both 101→102 and 102→103 at 103.1. Two bricks therefore arise from one source observation; brick close 103 is not source close 103.1.
Preserve close/OHLC source, box, seed and reversal rule: the documented TradingView convention needs one box for continuation and two for reversal; our fragment has no reversal. Bricks and projections are neither regular time nor proven fill prices. Lower-timeframe construction approximates tick-based bricks rather than recovering full tick history. Brick count is not verified wave count; review source bars and execution separately.
| Observation | Source close | New bricks / seed |
|---|---|---|
| 0 | 100 | M0:99→100 |
| 1 | 100.4 | No new brick |
| 2 | 101.2 | M1:100→101 |
| 3 | 103.1 | M2:101→102; M3:102→103 |
Does brick close 103 establish an order fill at 103?
No. It is a synthetic construction level, establishing neither execution nor exact timing.
M1–MN1: nine intervals and aggregation boundaries
M commonly denotes minutes in M1/M5; we write MN1 for a month. In Pine, “1” means one minute, “1M” a calendar month, and one hour is “60”. Daily, weekly and monthly boundaries depend on sessions and timezone; a month is not a fixed 30 days. Check available periods and history in the selected platform.
The table defines nine independent invented aggregations. For n child bars, set C_i=100+2 i/n, O_1=100, O_i=C_(i−1), H_i=103, L_i=99, V_i=10. Once boundaries are fixed, every parent has OHLC100/103/99/102 and volume 10 n. That computes OHLC, not five waves; the same parent hides different internal paths. W1 assumes five daily sessions; MN1 assumes one selected month with 20 sessions.
A separate invented candidate for each of the nine intervals is P0…P5=100→120→110→145→125→150, with each step one selected interval. Motive lengths 20/35/25, second point 110 above origin 100 and fourth 125 above 120 pass necessary price checks. Five M5 steps span 25 minutes, five H4 steps 20 hours, five MN1 steps five calendar months. Internal subdivisions remain unknown: equal prices and another duration establish neither a completed impulse nor a different degree. This candidate is independent of the aggregation example above.
| Interval | Child bars | Pine | Volume | O / H / L / C |
|---|---|---|---|---|
| M1 | 4 × 15s | 1 | 40 | 100 / 103 / 99 / 102 |
| M5 | 5 × M1 | 5 | 50 | 100 / 103 / 99 / 102 |
| M15 | 3 × M5 | 15 | 30 | 100 / 103 / 99 / 102 |
| M30 | 2 × M15 | 30 | 20 | 100 / 103 / 99 / 102 |
| H1 | 2 × M30 | 60 | 20 | 100 / 103 / 99 / 102 |
| H4 | 4 × H1 | 240 | 40 | 100 / 103 / 99 / 102 |
| D1 | 6 × H4 (24h) | 1D | 60 | 100 / 103 / 99 / 102 |
| W1 | 5 × D1 | 1W | 50 | 100 / 103 / 99 / 102 |
| MN1 | 20 × D1 | 1M | 200 | 100 / 103 / 99 / 102 |
MN1 = 30 × D1?
M commonly denotes minutes in M1/M5; we write MN1 for a month. In Pine, “1” means one minute, “1M” a calendar month, and one hour is “60”. Daily, weekly and monthly boundaries depend on sessions and timezone; a month is not a fixed30days. Check available periods and history in the selected platform.
Sources
Sources checked: 2026-10-20
This material and its translations were prepared with AI assistance. Educational calculations were checked programmatically. Sources explain concepts; examples and files were created for this article.
Related reading
Next step
Check how price adjustments and missing bars can change that same history.
Historical prices: splits, dividends and missing candles →