Data and boundaries
Source: Bybit, BTCUSDT spot market. Interval: D1; bar dates use UTC and prices are USDT per BTC. The chart shows actual daily price bars from 8 March to 14 April 2023; the selected movement starts on 10 March.
This is a retrospective study. The main hypothesis uses a cutoff of 14 April 2023. A later observation appears separately and does not establish that the peak could have been identified beforehand. This is a manual educational count, not an output from the software.
Six turning points
Labels 0–5 propose wave endpoints at one degree. Dates and prices come from bar highs and lows. The wave numbers are an interpretation, not fields supplied by the exchange.
| Label | UTC date | Bar field | Price USDT |
|---|---|---|---|
| 0 | 2023-03-10 | Low | 19555.00 |
| 1 | 2023-03-14 | High | 26393.33 |
| 2 | 2023-03-15 | Low | 23890.95 |
| 3 | 2023-03-22 | High | 28868.00 |
| 4 | 2023-03-27 | Low | 26505.00 |
| 5 | 2023-04-14 | High | 31019.60 |
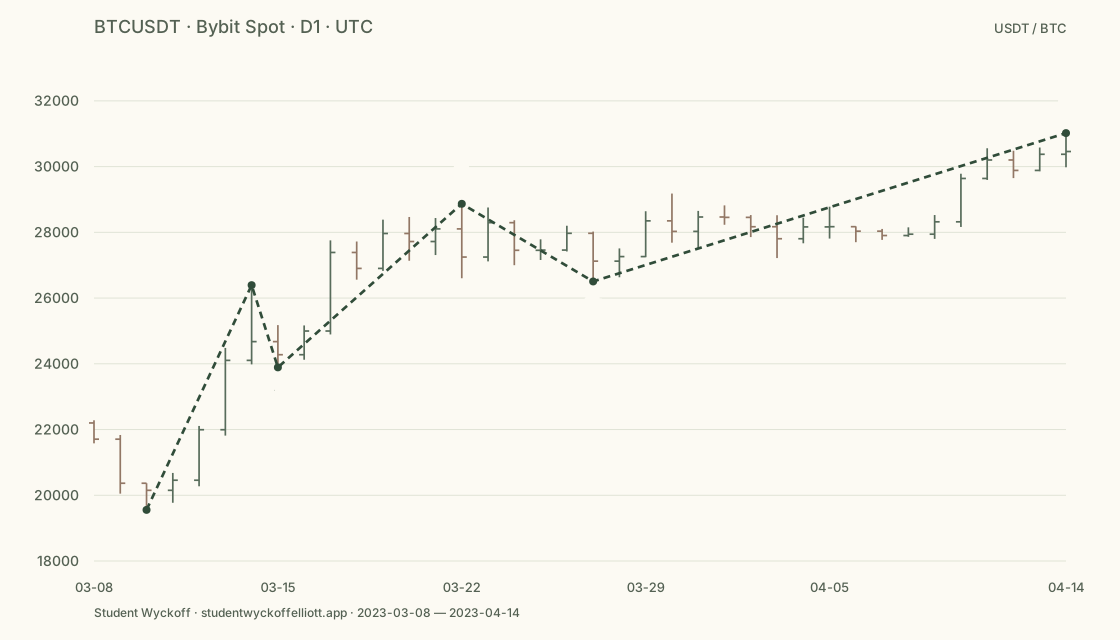
Read the movement step by step
- Separate direction from pattern identity. Price rose between the 10 March low and the 14 April high; that fact alone does not establish an impulse.
- Propose 0–1–2–3–4–5. Advances end on 14 March, 22 March and 14 April; pullbacks end on 15 and 27 March. Inspect the intervening bars, not just the lines joining endpoints.
- Apply the price checks below, then examine the internal structure. An ordinary impulse requires 5–3–5–3–5 subdivisions. This daily study does not fully establish them; finer bars are needed to investigate. Passing three price checks keeps a candidate under consideration but does not complete its validation.
Three price checks
Lengths use price points on a linear scale and the same data source throughout.
| Check | Result |
|---|---|
| Wave 2 above the origin 0 | 23890.95 > 19555.00 — condition satisfied. |
| Wave 3 not shortest among 1, 3 and 5 | 4977.05 > 4514.60 — wave 3 exceeds wave 5, although it is shorter than wave 1. |
| Wave 4 above wave 1 territory | 26505.00 > 26393.33 — a margin of only 111.67 USDT. |
Lengths: wave 1 = 6838.33; wave 3 = 4977.05; wave 5 = 4514.60 USDT. The small gap between waves 1 and 4 explains why closing prices cannot replace actual extremes and data from different venues should not be mixed.
Alternative and revision conditions
One working interpretation treats the entire rise as (1)? of a larger advance. An alternative treats it as (A)? of an upward zigzag correction. Five local movements do not determine the larger role: preceding history and subdivisions must also be examined. That larger role remains unresolved here.
At the 14 April cutoff, the endpoint at 31019.60 is provisional too. A higher high would reject the claim that wave 5 had already ended at that exact price; it would not automatically invalidate every upward pattern. A subsequent decline to 19555.00 or lower would contradict a wave (2) interpretation following the selected origin.
Separate later check: the 12 May daily low was 25811.56, below endpoint 4 at 26505.00. It is the first subsequent daily bar in the saved sequence whose low breaches that level. This establishes a deeper pullback, not a unique count or predictive skill. Revision conditions here are not orders or ready-made stop levels.
Check your understanding
Why does wave 3 pass when lengths are 6838.33, 4977.05 and 4514.60? What changes if the wave 4 low is 26300?
Show explanation
Wave 5 is shortest, so wave 3 passes this condition. At 26300, wave 4 enters wave 1 territory and the same ordinary-impulse candidate must be rejected. Do not preserve it by ignoring overlap; investigate any alternative pattern afresh.
The reproducible process is to save data, propose endpoints, calculate constraints, inspect subdivisions and record an alternative. A complete wave model requires more than five labels on a chart.
Source and reproducibility
The CSV retains daily OHLCV from 8 March to 12 May 2023. The main chart ends on 14 April; later rows support the separate follow-up. These prices describe Bybit Spot specifically, not every BTC market.
Historical educational study. This is not a current forecast or a recommendation to trade.
Continue learning
Continue reviewing the count
Read how to review and revise a count and what an Elliott wave forecast can establish. A historical learning example is not a current BTC forecast.
Compare the process on DAX
A second historical lesson separates an extreme’s date from its local confirmation time and tests the hypothesis without later bars.