Instrument, source and boundaries
Yahoo Finance ^GDAXI, DAX P: the dividend-reinvestment DAX index, EUR series, daily D1 bars. This is an index, not a future or contract for difference (CFD); values are index points, not euros of profit. Session dates use Europe/Berlin with CET/CEST transitions. DAX had 30 constituents in 2020.
The fixed window is 2020-01-02–2020-09-30, the first three quarters: 191 bars, no invalid OHLC and no missing sessions against the Xetra calendar. OHLC means opening, highest, lowest and closing values. Holidays and weekends were not filled; no price adjustment or source mixing was applied. The CSV uses decimal points and YYYY-MM-DD dates.
This is a retrospective manual lesson from a snapshot saved on 17 October 2026, not a fresh quote or software output. The period includes a decline, recovery and subsequent fluctuations; it was selected to examine reasoning, not returns. The author chose six real bar extrema. That hindsight selection is not presented as a mechanical signal or a forecast made in 2020.
Six anchors form a provisional count
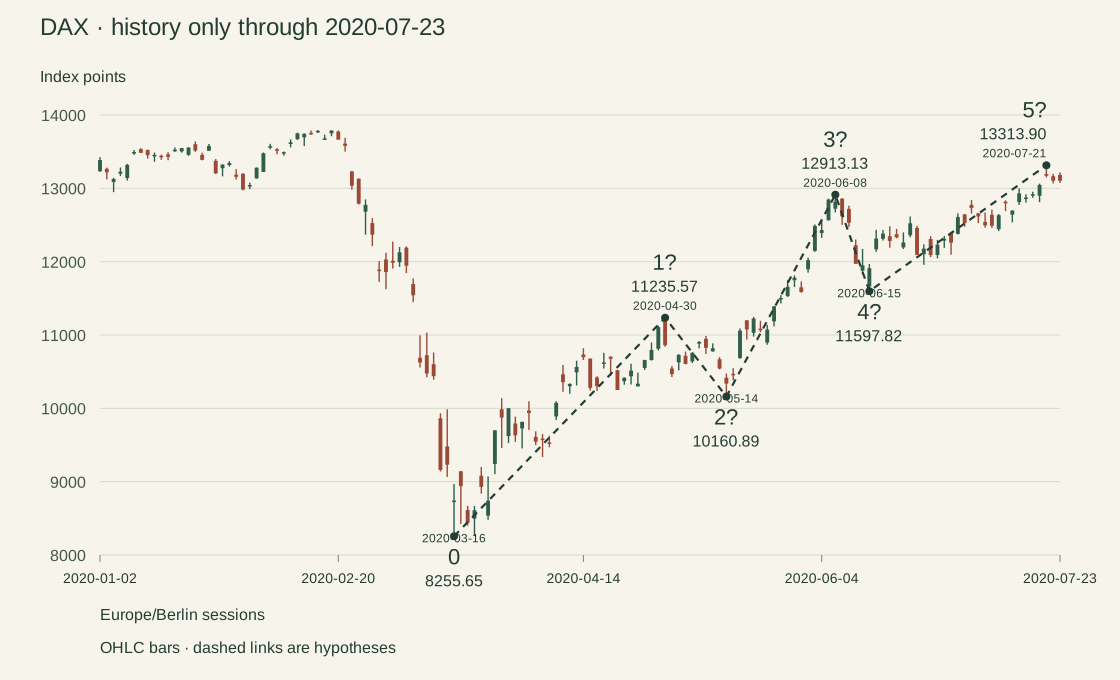
Labels 1?–5? propose endpoints at one relative degree. Connecting lines do not replace price bars. A local pivot has two lower highs or higher lows on each side and becomes knowable only after the second right-hand bar closes. This is the lesson’s replay convention, not an Elliott rule or proof of a completed wave.
| Label | Extreme date · Berlin | Field | Index points | Local pivot known after close |
|---|---|---|---|---|
| 0 | 2020-03-16 | Low | 8255.65 | 2020-03-18 |
| 1? | 2020-04-30 | High | 11235.57 | 2020-05-05 |
| 2? | 2020-05-14 | Low | 10160.89 | 2020-05-18 |
| 3? | 2020-06-08 | High | 12913.13 | 2020-06-10 |
| 4? | 2020-06-15 | Low | 11597.82 | 2020-06-17 |
| 5? | 2020-07-21 | High | 13313.90 | 2020-07-23 |
What was knowable at each step
Each row uses only bars through its stated close. Two left-hand sessions establish the point’s surroundings; two right-hand sessions introduce delay. Wave roles remain the author’s interpretations; later rows are unavailable to earlier steps.
| Cutoff after close | Already observed fact | Interpretation and revision condition |
|---|---|---|
| 2020-03-18 | 2020-03-16 · Low · 8255.65 | The local March low is known. The April–July anchors are still unknown; movement from 0 is developing. |
| 2020-05-05 | 2020-04-30 · High · 11235.57 | The April peak is locally observable; 1? is a hypothesis. A higher high would require reviewing the selected endpoint, but would not by itself invalidate every upward interpretation. |
| 2020-05-18 | 2020-05-14 · Low · 10160.89 | The 2? low is above origin 0. A proposed second wave at or below 8255.65 would exclude this count; the correction’s structure still needs examination. |
| 2020-06-10 | 2020-06-08 · High · 12913.13 | The 3? high exceeds endpoint 1?. Until a fifth endpoint is selected, lengths 1, 3 and 5 cannot be compared conclusively. |
| 2020-06-17 | 2020-06-15 · Low · 11597.82 | The 4? low exceeds 11235.57. Overlap of wave 1 during the proposed fourth would exclude the same ordinary impulse; another pattern needs fresh justification. |
| 2020-07-23 | 2020-07-21 · High · 13313.90 | A local July peak and three selected lengths are available. 5? remains conditional: a local pivot does not establish completion of the whole pattern or its larger role. |
Price constraints of the selected hypothesis
Use extrema from one source, rather than closes. The chart is linear; the arithmetic below uses CSV values to two decimals.
| Check | Calculation |
|---|---|
| Second above the first-wave origin | 10160.89 > 8255.65. Condition satisfied. |
| Third not shortest among 1, 3 and 5 | L3 = 2752.24 > L5 = 1716.08; the selected fifth is shortest. |
| Fourth above first-wave territory | 11597.82 > 11235.57; margin 362.25 points. |
L1 = 11235.57 − 8255.65 = 2979.92; L3 = 12913.13 − 10160.89 = 2752.24; L5 = 13313.90 − 11597.82 = 1716.08 points. Relative moves are 36.10%, 27.09% and 14.80%: the third is not shortest on that basis either.
Price also progresses: 12913.13 > 11235.57, followed by 13313.90 > 12913.13. These are endpoint price checks, not full impulse validation.
Nesting, alternatives and status
An ordinary impulse requires 5–3–5–3–5 internal subdivisions. This study does not fully establish those subdivisions within all five legs. Daily endpoints alone are insufficient; finer bars and a separate review of each leg are needed. Wave degree describes relative nesting, not an official rank automatically assigned by the daily interval.
A larger advance’s (1)? and a corrective rise’s (A)? remain conditional alternatives; their full preceding and internal context is not established. A diagonal has different rules and cannot simply be named to rescue a failed impulse. Invalidation levels here test a model; they are not trading orders.
- Completed: Sessions and the selected anchors’ price-constraint arithmetic.
- Developing: Movement at each cutoff before the next pivot becomes observable.
- Unresolved: Full internal subdivisions and the larger-degree role.
- Conditional: Labels 1?–5?, (1)? and (A)? until sufficient structural evidence.
Reveal later bars separately
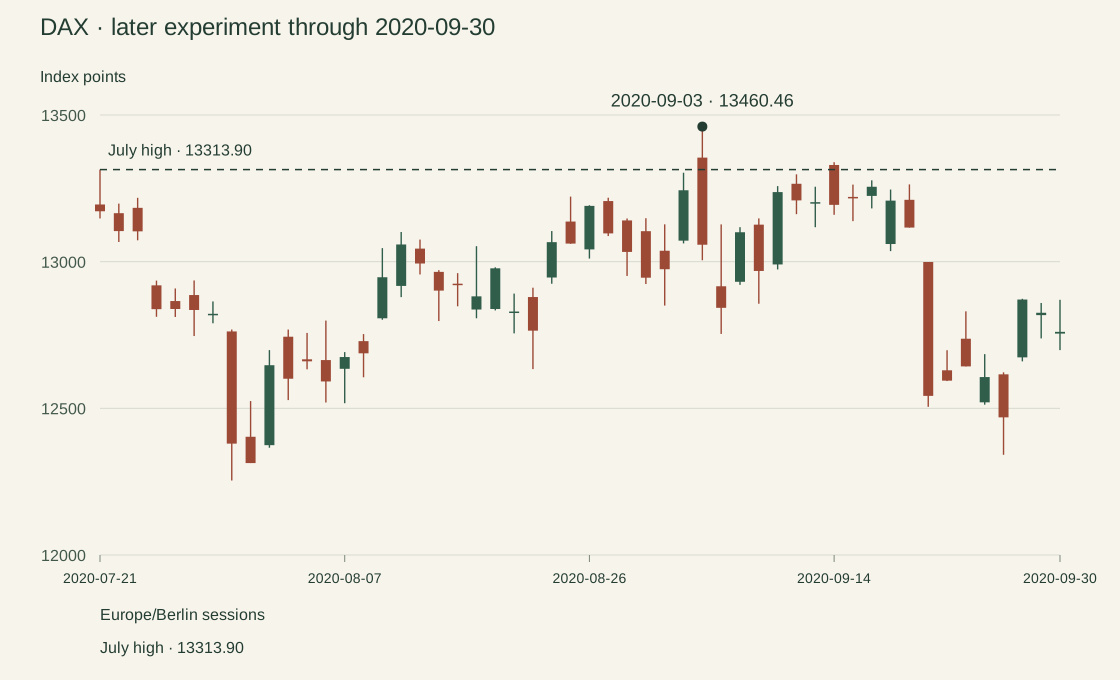
The main chart stops at 2020-07-23. Only in the next experiment do we add bars through 2020-09-30. The first subsequent daily high above 13313.90 appeared on 2020-09-03: 13460.46, or 146.56 points higher. It was unavailable at the July cutoff.
This refutes the claim that July’s peak would remain the highest through quarter-end. A new high alone neither proves an extension of that fifth nor automatically disproves its possible completion: a larger corrective wave can also exceed a previous peak. Structure is required, rather than a new label fitted to a known outcome.
Test the conclusion
If the proposed fourth-wave low were 11200, could the same ordinary impulse survive? Do two right-hand bars prove a completed fifth?
Show explanation
No: 11200 is below 11235.57, creating overlap with wave 1. Two right-hand bars establish only a local pivot under this lesson’s convention. Full structure and completion of the fifth require separate evidence.
Sources and reproduction
Save the CSV, compare its extrema with the table and progressively cut the data at each cutoff. The calculations are manual and reproduced by a script; the calculation engine was not run. The metadata file describes the instrument, precision and provenance.
- Yahoo Finance instrument
- STOXX DAX EUR Gross Return
- Xetra 2020 calendar
- Impulse rule source
- Motive-wave rule source
- Download 191 daily bars CSV
- Data metadata and provenance
Historical educational material. No current forecast, trade recommendation, price target or return estimate is provided.
Compare model rejection on a stock
The historical TSMC lesson shows how overlap rejects a proposed impulse, why equal lows matter and how actual traded prices differ from dividend total return.