GUIDE · PRO AND LIGHT
Your first Elliott wave calculation.
Start with one instrument and a movement you can recognise. Loading prices, choosing the range and calculating waves are separate actions.
Prepare the workspace.
Before the first run, read the Pro installation and requirements or the Light setup guide. Pro is a standalone Windows application. Light needs a browser, an installed Windows module and internet; calculations run on your computer. Both offer built-in Yahoo Finance downloads; TradingView CSV import is available only in Pro.
Five steps to a result.
Load prices
Select the instrument and bar interval. Wait for the chart. Loading data does not itself start the wave calculation.
Check the data
Verify the symbol, interval, first bar and last bar. Daily and weekly histories provide different levels of detail.
Choose the range
Use all loaded history, LBC—the calculation start line—or explicit start and finish points. Check dates and the bar count.
Run the calculation
Select Calculate waves and wait for the result. Duration depends on the data, market structure and computer.
Read the result
Begin with a larger visible degree, then add the smaller degrees. Compare alternatives and incomplete-count messages.
Review before drawing conclusions.
The result must match the selected data and range. Recalculate after changing either. Question marks and unfinished components require review. The saved Pro screenshot below illustrates the interface; it is not a current forecast for Microsoft.
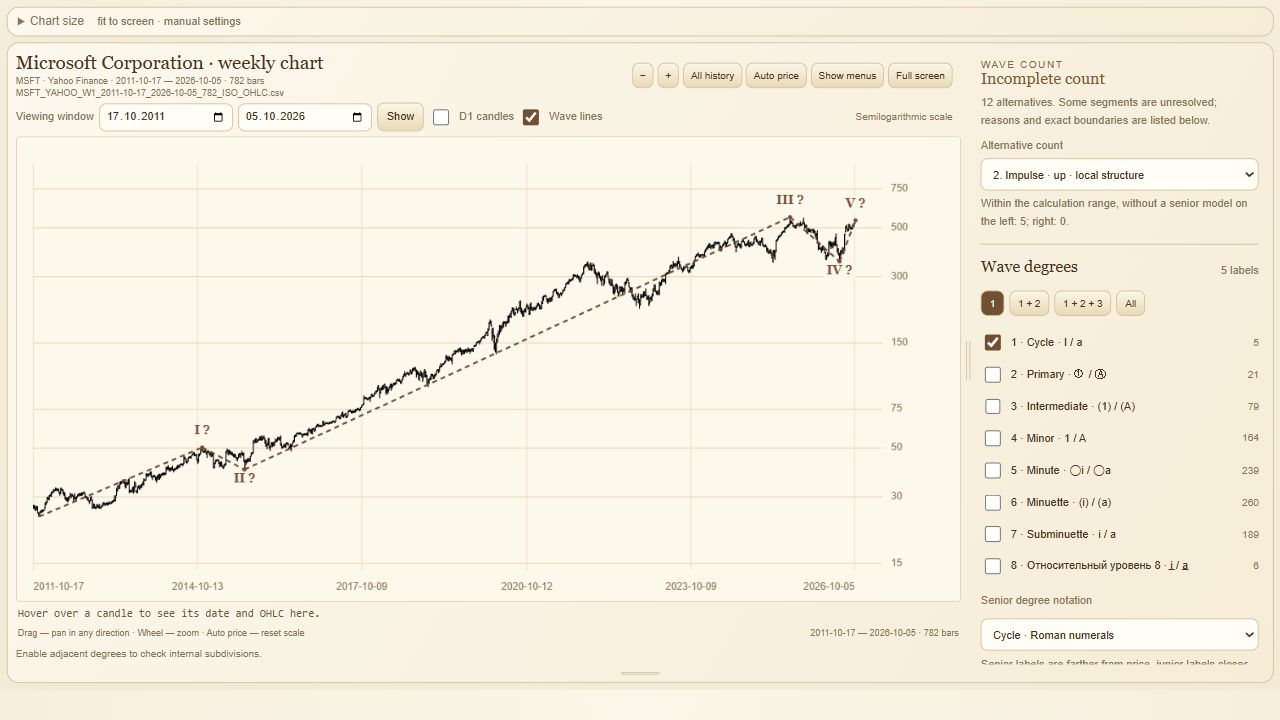
Read the result after the button finishes.
Start with the input and completion messages, then one larger degree, its smaller parts and an alternative. A visible chart is not proof that the whole model is complete. A question mark or an unresolved part remains conditional.
| Read first | Record |
|---|---|
| Input | Instrument, source, interval, first/last bar and range |
| Structure | Larger degree, smaller parts and unresolved components |
| Hypothesis | Alternative selected and a condition that would reject it |
Keep a small review record.
Write the six input facts from the table, the alternative and the point that would make you reassess it. If bars or boundaries change, treat the next run as a different case. A saved interface image does not establish that a current calculation reproduced it.
The chart looks plausible, but the selected interval differs from your exported file. Can you compare it with yesterday's count?
Show the explanation
Correct the mismatch first and record the inputs. Different intervals aggregate different price extremes. Only compare like-for-like cases, then inspect structure and unresolved parts; more labels do not establish a better result.
How do you review and revise an Elliott wave count?
Start with the same set of completed bars: keep the instrument, source, interval, first and last bar, and calculation boundaries unchanged. Then check the proposed structure against the wave rules; a plausible outline is not enough.
Compare alternative counts on those same data and at one wave degree. Record unfinished components and the condition that would make you revise a candidate. Changed bars or boundaries may change the result: record this as a new calculation before comparing it with the earlier one.
Practise a manual count review
Repeat the price checks in the historical BTCUSDT example using the saved daily bars. This is a manual learning exercise; its count is not software output.