GUIDE · PRO AND LIGHT
How to compare alternative Elliott wave counts.
A single range may admit several wave scenarios. Compare their structure and limits while holding the input data constant.
Fix the starting conditions.
Check the instrument, data provider, bar interval, last-bar date and analysis boundaries. Different inputs can explain different counts before model selection is considered.
Compare two alternatives.
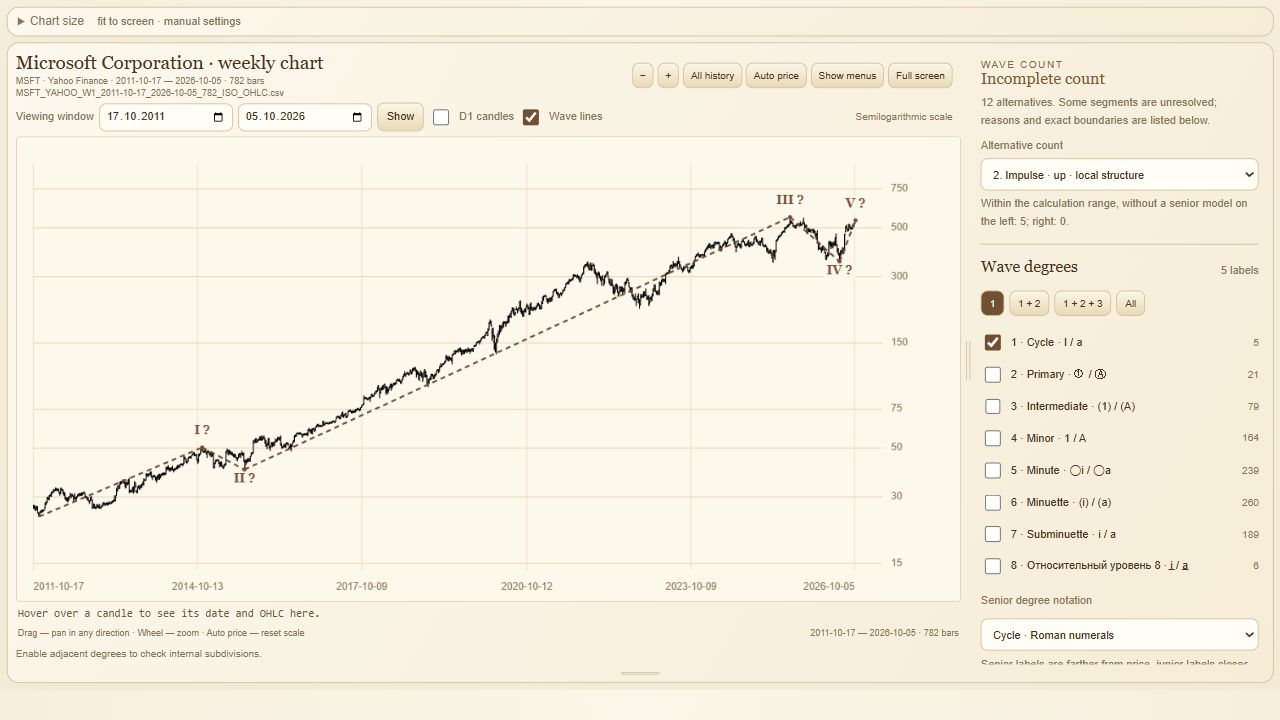
Switch the alternative and compare the larger structure, internal subdivision and unfinished components. Note what remains common and where the scenarios differ. The analyst assesses these findings together with the price chart.
Allow for new information.
New confirmed turning points and changed boundaries may alter the selected count. The search is resource-bounded, so a chosen scenario does not prove a unique correct forecast. The saved Pro screenshot illustrates the interface; use the software messages to assess the completeness of its result.
One price path, two provisional roles.
The same nine invented prices can raise different hypotheses. A treats the five-wave rise as the beginning of a larger advance; B treats it as the last leg of a larger correction. The earlier movement is not drawn, so this diagram does not establish two complete valid counts.
Write down what would reject each hypothesis.
An invalidation condition must refer to the exact proposed structure. A broken condition rejects that hypothesis, not Elliott analysis as a whole. The two conditions below are not orders, trade entries or automatic stops.
| Working hypothesis | What to verify | Review condition |
|---|---|---|
| A: 100→130 is (1), the decline is (2)? | The preceding context and valid subdivisions of (1) and (2) | 100 or lower contradicts this upward (1)–(2) hypothesis |
| B: 100→130 is (C)? ending a larger upward correction | The earlier (A)/(B), internal structure of C and evidence that its endpoint is 130 | Above 130 rejects the assumed endpoint at 130; C might instead still be developing |
Try it on the same data.
Use equal data, range and degree when comparing alternatives. A preferred count is a working choice, not a measured probability. Do not assign a success percentage just because a program ranks candidates.
A new price reaches 132. Does that alone invalidate A? What happens to B's assumed endpoint at 130?
Show the explanation
132 does not violate A's stated lower boundary of 100, but it does not confirm A's subdivisions either. It rejects B's assumption that the upward correction ended at 130. Reconsider whether C is still developing or another structure fits; do not automatically declare the whole alternative family impossible.
Repeat the review in your own workspace
Keep the data, range and wave degree from your comparison record. Follow that process in the first-calculation guide. For your own CSV files, use the standalone Pro application for Windows; for built-in daily, weekly and monthly data, consider Light with its required Windows module. Record changed inputs as a new calculation.