GUIDE · PRO AND LIGHT
Where to start a wave count: ranges and LBC.
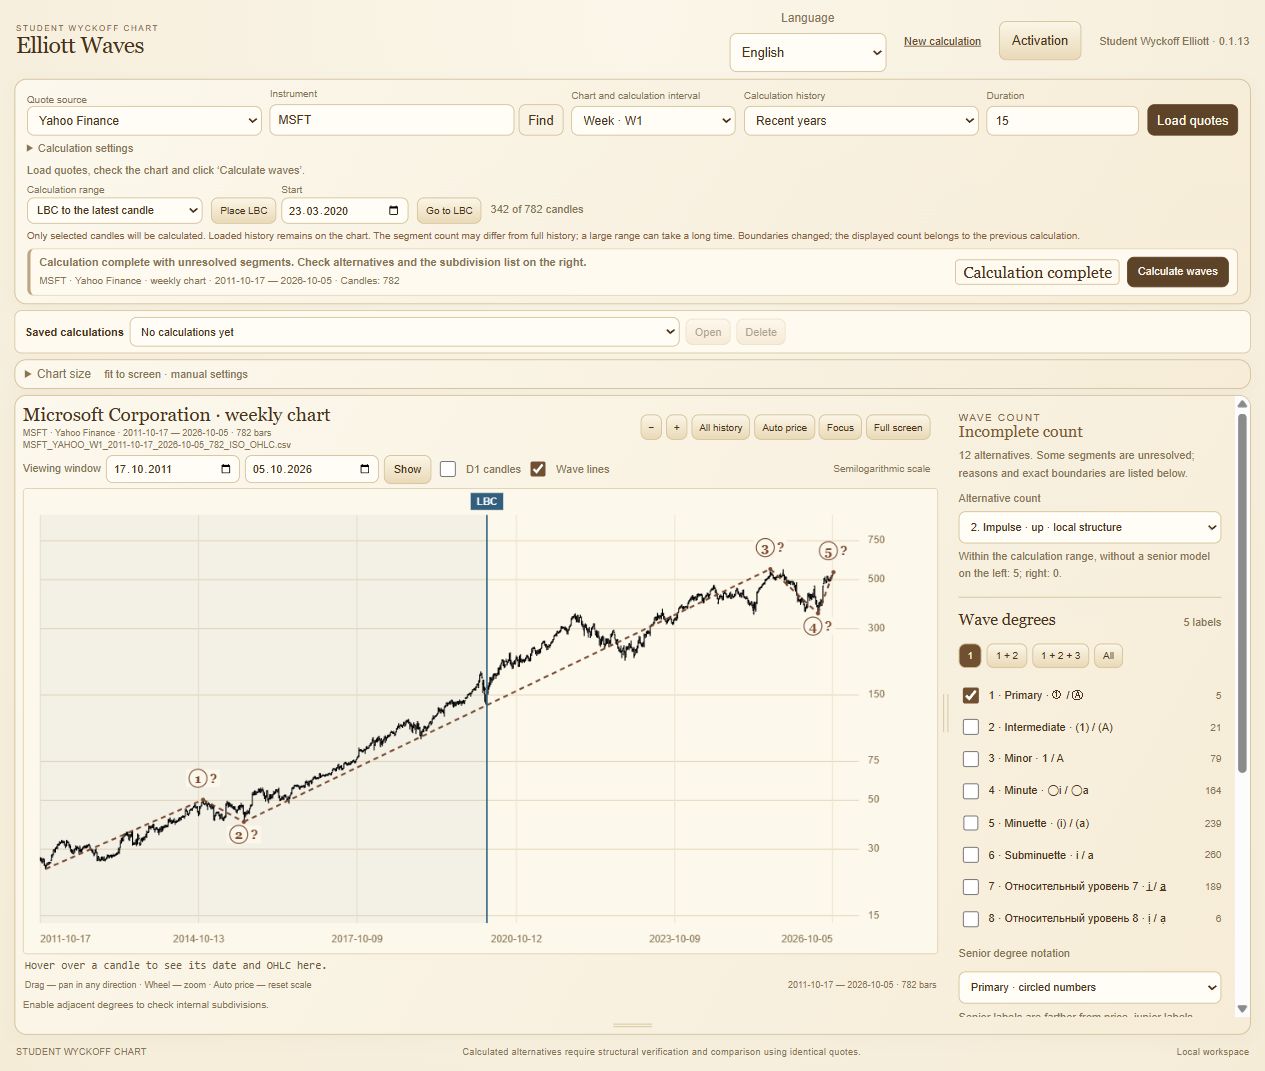
LBC is the vertical calculation start line. Use it to examine a selected trend without calculating all loaded history. The range controls are available in Pro and Light.
Three ways to select history.
All loaded history
Use every loaded bar. This suits broader context when you are prepared to wait for a larger range to be processed.
LBC to the latest bar
You select the beginning; the end is the latest loaded bar. Useful for exploring a current local move.
Start–finish
You set both boundaries. Useful for studying a completed move and repeating an analysis over the same range.
Set your boundaries.
Load and check your data
Choose an instrument and timeframe. Wait for the chart; the calculation starts separately.
Choose a range mode
Select LBC or start–finish in the calculation range control. Daily charts also offer range selection before calculation.
Place LBC
Select “Place LBC” and choose a bar on the chart, or enter the start date. In start–finish mode, choose the final bar too. Check the dates and bar count.
Calculate and compare
Select “Calculate waves”. Check the selected boundaries, alternative counts and nested degrees in the result.
Give the move some context.
A very short range can hide the preceding turn or part of a larger structure. For example, begin near the preceding local low when studying an upward move, then compare the result with an earlier starting point. This is a research approach, not a guarantee of a correct count.
Moving a boundary changes the input data. A short-range count can differ from a full-history analysis. Fewer bars often mean less work, but timing depends on the structure and your computer.
What LBC changes in each version.
In Light, selection stays inside the loaded limit: D1 up to 3 calendar years; W1/MN1 up to 150 completed bars. LBC does not load older data. In Pro, intraday CSV import first selects 100–500 source bars; you can then narrow the range.
Nested waves are calculated within the selected boundaries. Begin with the larger degrees and add smaller ones as needed. A ? calls for checking; it is not a ready-made trading signal.
Where should a wave count start?
There is no universally correct start bar. First examine a wider range, identify the movement you want to explain, and then choose its boundaries. In the same teaching path, T0 is 100 and T5 is 130. Starting at T5 removes the preceding rise; it does not prove that the decline is a complete correction.
| Selection | What stays visible | What can be lost |
|---|---|---|
| T0–T8: 100→…→114 | The rise to 130 and the following decline | Earlier context before T0 |
| T5–T8: 130→120→126→114 | Only the local decline | The movement from 100 to 130 |
Try it on the same data.
Keep the instrument, source, interval and last completed bar fixed. Change only the start, record both ranges, and compare the larger structure. LBC selects a calculation range; it does not retrieve bars outside the loaded history.
You move LBC to T5 and the application finds a different count. Has the earlier count necessarily become wrong?
Show the explanation
No. You changed the evidence supplied to the calculation. Compare the two counts in their own ranges and review the earlier context. A shorter count is neither automatically better nor proof that the wider one is invalid.