GUIDE · PRO AND LIGHT
Elliott wave degrees: labels and nested waves.
A degree is the level of a wave within a larger structure. Examine the whole movement first, then explore its smaller components.
Find the whole movement first.
Display one larger degree and identify the boundaries of the movement. A degree name does not imply a fixed chart interval: daily and weekly bars expose different detail.
Add detail gradually.
Enable the next degree and follow how smaller waves form the chosen larger component. When comparing display settings, keep the instrument, input bars, analysis range and alternative unchanged. Displaying another degree and changing the calculation range serve different purposes.
Check how the parts connect.
Compare endpoints, order and direction. More labels do not prove that a model is complete. Conditional roles, question marks and unresolved areas still matter. The saved Pro image below shows a weekly Microsoft chart with one visible degree; it is not a current assessment of the stock.
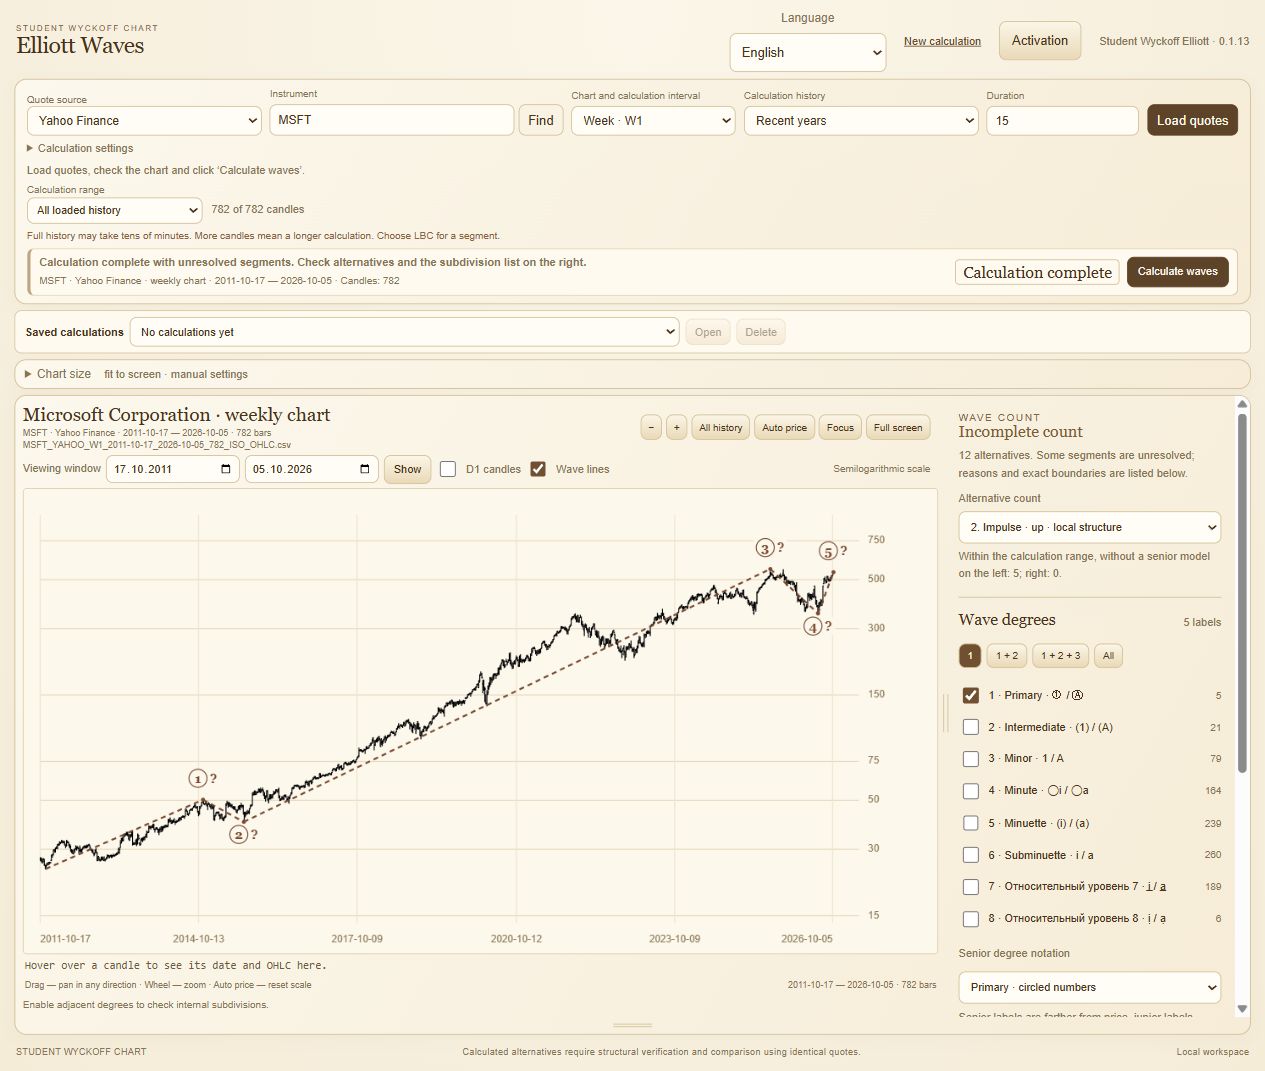
Labels describe relationships, not calendar time.
These three rows use a simplified teaching convention, not a complete degree hierarchy or a colour legend for the application. A daily bar interval and a wave degree describe different things. Enlarging the chart does not create a new degree.
| Relative level | Example labels | How to read it |
|---|---|---|
| Larger | (1), (2) | A movement and its correction |
| Inside (1) | 1, 2, 3, 4, 5 | Parts that together make the larger movement |
| Inside a smaller part | i, ii, iii, iv, v | Another level of detail; subdivisions still need verification |
Follow one movement from outside to inside.
In the diagram, 100→130 is a possible larger (1). The five swings 100→110→104→124→116→130 are its proposed smaller parts. The decline 130→120→126→114 is a possible (2), still requiring review. Here the smaller parts are shown as 1–5 to distinguish them visually. Price endpoints pass only initial checks; they do not prove a complete impulse.
Try it on the same data.
Keep the input and alternative unchanged while you switch the visible degree. Then inspect the endpoints of one parent component and its children. Missing internal data remains missing even if you hide its labels.
You switch from daily to weekly bars and see fewer labels. Does that prove that the wave degree has changed?
Show the explanation
No. You changed the input bars and the available detail. The degree follows the role of a wave inside its parent, not a fixed bar interval. Compare parent boundaries and subdivisions before assigning labels.