Stock, source and fixed window
The instrument is Taiwan Semiconductor Manufacturing Company common stock, code 2330 on the Taiwan Stock Exchange, TWSE, quoted in TWD, New Taiwan dollars. It is not the US depositary security TSM, an index or a contract for difference (CFD). We use the exchange's reported daily open, high, low and close, OHLC, under local Asia/Taipei dates, UTC+8.
The fixed window covers the first three quarters of 2022: 3 January–30 September, 182 trading days. Nine monthly CSVs were obtained using TWSE's official download button and checked against the displayed tables. Thirteen weekday closures agree with the exchange calendar; there are no missing expected sessions or invalid OHLC rows. Weekends and holidays were not filled.
The stock and window support a lesson about rejecting a model, equal extremes and corporate events, rather than selecting for returns. The author selected the zones retrospectively. This is neither a forecast published in 2022 nor engine output. The main chart stops on 2 June; later bars are revealed separately.
Dividends and comparable prices
The series retains actual unadjusted traded prices. It is not back-adjusted for cash dividends and does not measure total return. Three ex-dividend dates occur within the window: 16 March, 16 June and 15 September, each at TWD 2.75 per common share. From the ex-dividend date, a new buyer is no longer entitled to the upcoming dividend. This is not the payment date. The 555.00 low is on 16 March, so that context matters.
No split was identified within the window: daily rows have no par-value adjustment mark, while the 2022 capitalization table records employee restricted-share awards and treasury-share cancellation at the same TWD 10 face value. The annual report was published in 2023 and is used for retrospective source checking, not as information available at the June 2022 cutoff. A change in share count is not automatically a split.
| Ex-dividend date | Per common share | Earnings period |
|---|---|---|
| 2022-03-16 | 2.75 TWD | 2021 Q3 |
| 2022-06-16 | 2.75 TWD | 2021 Q4 |
| 2022-09-15 | 2.75 TWD | 2022 Q1 |
A dividend gap is not automatically a separate wave. Do not rescue a count by adding a dividend to one selected anchor: a different price basis requires a consistently adjusted whole OHLC series and a stated method. These price differences are not an investor's profit.
Anchors of the provisional hypothesis
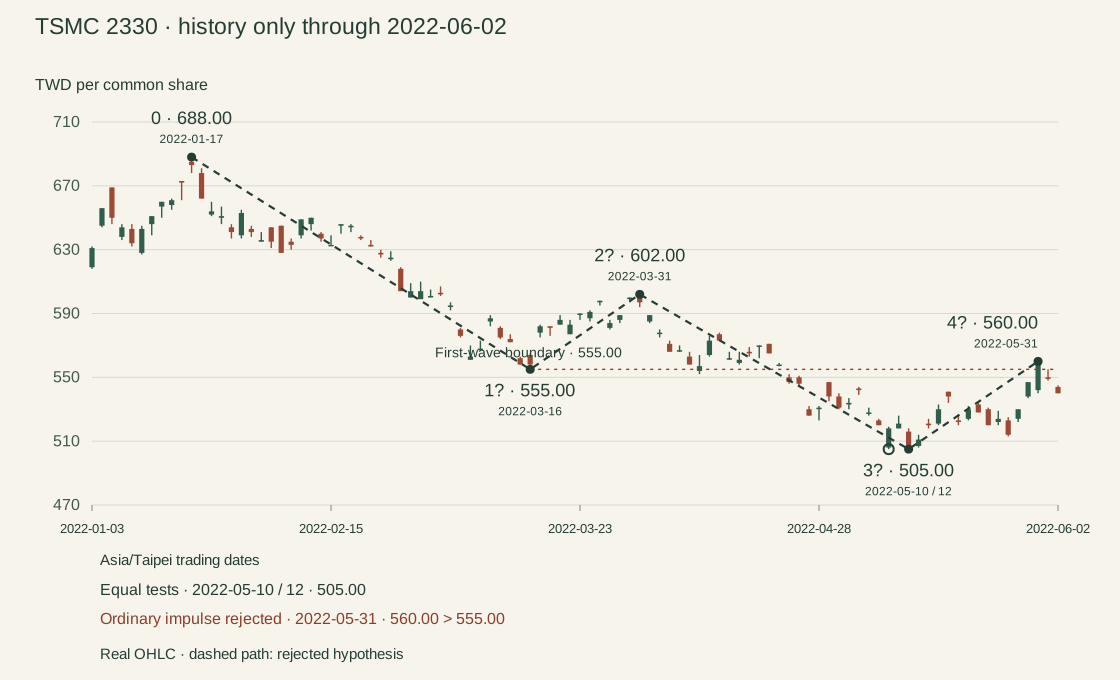
Labels 1?–4? are a hypothesis at one relative degree. Dashed connections do not establish internal wave structure. This lesson's local check uses two outer sessions before a selected zone and two after it, all with less extreme prices. It is an author's historical replay convention, not an Elliott rule.
The 505.00 low was tested on both 10 and 12 May, with one bar between them. Neither date becomes a uniquely proven third-wave endpoint. For the confirmation delay we use the last test, 12 May; the next two higher lows were available on 16 May. Both equal tests remain visible in the chart and table.
| Label | Extreme / zone date | Field | TWD per share | Locally knowable after daily row |
|---|---|---|---|---|
| 0 | 2022-01-17 | High | 688.00 | 2022-01-19 |
| 1? | 2022-03-16 | Low | 555.00 | 2022-03-18 |
| 2? | 2022-03-31 | High | 602.00 | 2022-04-06 |
| 3? | 2022-05-10 / 2022-05-12 | Low | 505.00 | 2022-05-16 |
| 4? | 2022-05-31 | High | 560.00 | 2022-06-02 |
What was available at each step
Each step uses only completed daily rows through its stated date. Local confirmation of an extreme and invalidation of a rule are different events. The zones were selected retrospectively; the table does not represent a mechanical strategy running in 2022.
| 2022-01-19 | The local 688.00 high of 17 January is observable. March and May anchors are still unavailable; movement from 0 is developing. |
|---|---|
| 2022-03-18 | The 555.00 low of 16 March is locally observable. A rebound may be a provisional second wave; its future endpoint is unknown. The cash-dividend event shares this date. |
| 2022-04-06 | The 602.00 high of 31 March is locally confirmed after two further trading sessions. It lies below 688.00; this satisfies only one price condition. |
| 2022-05-16 | Both 505.00 tests on 10 and 12 May are known. Two higher lows follow the last test. Neither wave role nor a unique endpoint date has been proved. |
| 2022-05-31 | The daily high 560.00 entered first-wave territory above 555.00. This ordinary downward impulse is already rejected; a confirmed local peak is not needed. |
| 2022-06-02 | Only now do two subsequent bars confirm the local high 560.00 of 31 May under the replay convention. This does not move the already observed invalidation date or restore the count. |
Why the ordinary impulse fails
The test concerns an ordinary cash-market stock impulse. In a downward version, wave 2 cannot return to the start of 1, wave 3 cannot be the shortest of 1, 3, 5, and wave 4 cannot enter first-wave price territory. Diagonals have separate requirements.
| Second below the origin | 602.00 < 688.00. The condition passes, but the complete impulse is not established. |
|---|---|
| Fourth overlaps the first | 560.00 > 555.00: overlap of 5.00 TWD. It is observable in the 31 May daily row; the ordinary impulse fails. |
| Third must not be shortest | At the 2 June cutoff no fifth endpoint exists yet. The final three-length comparison is unavailable at this step; the later experiment is separate. |
There is no need to wait for a reversal or two future bars to detect overlap that has already occurred. Local peak status and model validity have different evidence. A daily bar cannot reveal the exact intraday moment of the first crossing.
Internal structure, degree and states
Selected endpoints alone do not establish an impulse with 5–3–5–3–5 internal subdivisions. Smaller intervals and separate evidence are needed to check each internal segment. Daily timeframe does not assign a formal wave degree: degree describes relative nesting.
Rejecting this count does not reject every bearish interpretation. Yet it cannot automatically be renamed a diagonal, assigned another degree or relabeled A–B–C merely to preserve the line. Each alternative requires its own structural evidence. The larger role stays unresolved here.
- Completed: calendar, source-price and overlap checks.
- Developing: the subsequent price path at the 2 June main cutoff.
- Unresolved: internal subdivisions, degree and a unique May endpoint date.
- Conditional: wave roles and alternatives pending adequate structural evidence.
- Rejected: this particular ordinary downward impulse on the unchanged price basis.
Later history: a separate check
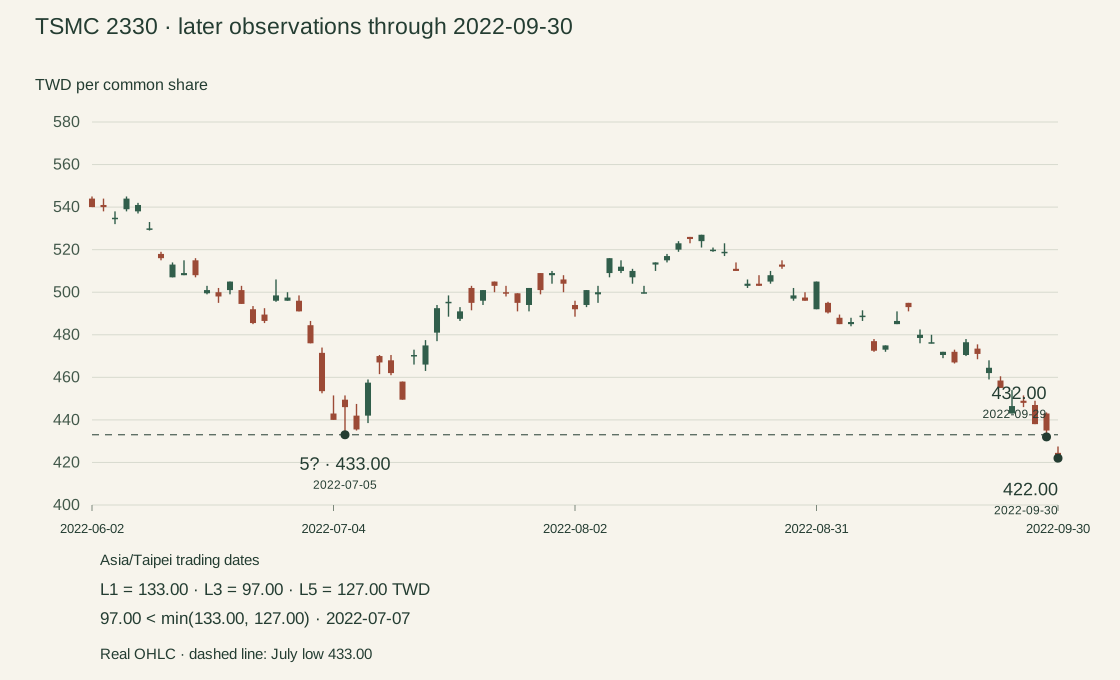
Only this section reveals history after 2 June. The 433.00 low of 5 July becomes locally checkable after the 7 July daily row. If it is added as 5? to the same already rejected proposal, the decline lengths are L 1=688.00−555.00=133.00; L 3=602.00−505.00=97.00; L 5=560.00−433.00=127.00 TWD.
97.00 < min(133.00, 127.00): the third is shortest. Relative declines give the same result: 19.33%, 16.11%, 22.68%. This is an additional later reason to reject that count; the fifth endpoint was unavailable on 2 June.
The first subsequent low below July's 433.00 after its confirmation was 432.00 on 29 September; 30 September reached 422.00. Continued decline is a price fact, not proof that the rejected labeling was correct. These observations do not become a current forecast.
Test the reasoning
Can the proposal regain ordinary-impulse status because price declined in July? Was it necessary to wait until 2 June to reject the 31 May overlap?
Show the explanation
No to both. A later decline does not remove 560.00 > 555.00. That violation is already present in the completed 31 May daily row. Two subsequent bars serve only the local peak-confirmation convention, not detection of overlap. Adding the July point to the same proposal also makes its third shortest. Preserve the equal May lows and dividend context instead of hiding them.
Sources and reproduction
To reproduce the check, save the CSV, truncate it at each cutoff and recalculate the comparisons. The full file contains 182 bars including later history; the main chart uses only the first 98. Metadata records provenance, precision, license and replay procedure. Original exchange CSV bytes are retained; the small published subset changes only date format and selected columns.
Data: Taiwan Stock Exchange / Securities and Futures Bureau, Financial Supervisory Commission, 2026; Daily Trading Information of Individual Securities, dataset 11549, observations 2022. Open Government Data License 1.0. Source prices are unchanged; selection and original charts are adaptations. The provider has not endorsed this wave interpretation.
- TWSE historical daily data
- TWSE trading calendar
- Open dataset 11549
- OGDL 1.0 license
- TWSE terms and open-data exception
- TSMC 2022 capital and shares
- Dividend: 16 March 2022
- Dividend: 16 June 2022
- Dividend: 15 September 2022
- EWI: ordinary impulse
- EWI: motive waves
- Download 182 barsCSV
- Metadata and calculations
EWI rules and pages 11–12 of the supplied 32-page Prognosis Elliott Wave Theory reference were checked. The lesson explicitly tests an ordinary impulse; exceptions for other models require their own evidence. Book illustrations were not copied. No engine was run; this lesson provides no trading signals or return calculation.