Linear and logarithmic scales: comparing price or percentage
Equal money changes and equal percentage changes occupy different distances on a price axis.
The same price bars can be displayed differently without changing any input value. A linear axis measures price differences. A logarithmic axis measures ratios of positive prices. A line’s slope without its axis definition is not an independent measure of a move’s strength.
Two kinds of distance
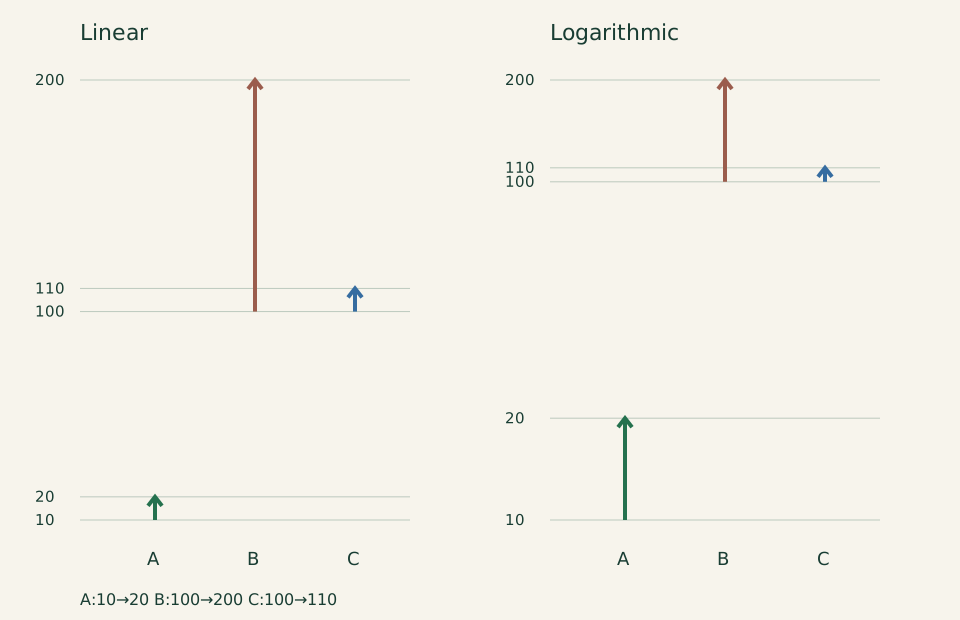
On a linear axis,100→110 has the same height as 10→20: both add 10 units. Their returns are 10% and 100%. A 100→200 change adds 100 units, so it is ten times taller than 10→20 on that same linear axis.
On a logarithmic axis, distance is proportional to ln(P 2/P 1). The doublings 10→20 and 100→200 have the same distance ln 2. A 100→110 rise gives ln 1.1 and is shorter. Changing the logarithm’s base changes a common multiplier, not equality of equal ratios.
Check the table against the authored axes
The table contains three independent invented moves, not a price sequence or real quotations. Both diagram axes run from 10 to 200 and use the same prices. The linear coordinate is(P−10)/190; the logarithmic coordinate is ln(P/10)/ln 20.
Ticks 10,20,100,110,200 need not sit at the same heights on the two axes. The diagram uses these formulas rather than hand-adjusted positions. Ordinary logarithms require strictly positive prices; zero and negative values are outside this model. Shifts or special transforms require a separate explanation.
Our own teaching example; all figures are hypothetical.
Δlinear = P2 − P1; Δlog = ln(P2/P1); ln(20/10) = ln(200/100)
| Move | Difference | Change | Log distance |
|---|---|---|---|
| 10→20 | +10 | +100% | ln 2≈0.693147 |
| 100→200 | +100 | +100% | ln 2≈0.693147 |
| 100→110 | +10 | +10% | ln 1.1≈0.095310 |
Keep the chart settings with the evidence
Record axis type, price bounds, bar interval and time range. Visible angles also depend on window proportions. When transferring drawings or comparing charts, align these conditions before interpreting similar-looking slopes.
A scale adds no future information, proves no trading signal and cannot repair bad prices. The view of an external chart also does not establish a program’s internal calculation method. For a repeatable study, first check the underlying historical series and its adjustments.
Does 20→40 have the same log distance as 100→200?
Yes.40/20=200/100=2, so both distances are ln 2. Their linear differences,20 and 100, are not equal.
Sources
Sources checked: 2026-10-21
This material and its translations were prepared with AI assistance. Educational calculations were checked programmatically. Sources explain concepts; examples and files were created for this article.
Related reading
Next step
Before comparing drawings, identify the historical prices and adjustments being displayed.
Historical prices: splits, dividends and missing candles →